

Track e-commerce performance to boost your Shopify store
TL;DR:
- Managing your e-commerce business with precise KPIs allows you to optimize profitability by identifying the essential levers. Regular, cross-referenced, and consistent measurement of performance indicators, particularly through Shopify and GA4, reveals the true health of the store. Cohort analysis offers an in-depth view by tracking customer value and retention over time for effective strategic management.
Many e-commerce managers still run their store by intuition: a good month of sales is enough to reassure, a traffic spike makes them believe there is great momentum. Yet, tracking e-commerce performance allows you to manage with a clear view of results, identify the real conversion and retention levers, and adjust the strategy in real time. In the beauty, fashion, and wellness sectors, where acquisition costs are skyrocketing and competition is intensifying, this data-driven management is no longer an advantage. It is an absolute necessity.
Table of Contents
- Why measuring e-commerce performance is essential
- Which KPIs to track on Shopify: the key indicators
- Methodologies and tools to analyze e-commerce performance
- Cohort analysis and advanced nuances for performance
- Our point of view: what most e-commerce managers overlook
- Take action: optimize your Shopify store with Tamara Agency
- Frequently asked questions about e-commerce performance
Key Points
| Point | Details |
|---|---|
| KPI management | Measuring the right KPIs allows you to make profitable decisions for a Shopify store. |
| Cross-analysis | Cross-referencing several indicators and using cohort analysis avoids the pitfalls of averages. |
| Right tools | Shopify Analytics and GA4 are essential for reliable sales and traffic tracking. |
| LTV/CAC by segment | Prioritizing the LTV/CAC ratio by channel and cohort ensures healthy and profitable acquisition. |
| Expert guidance | Benefiting from industry expertise accelerates e-commerce optimization and growth. |
Why measuring e-commerce performance is essential
After establishing this fact, let's explore why measurement is so crucial for managing an e-commerce store, particularly in your sectors.
Beauty and fashion brands operate in environments where every decision has a direct cost. Launching a campaign without knowing its CAC (customer acquisition cost) is taking a major financial risk. Adjusting a product page without analyzing visitor behavior is moving forward blindfolded. The beauty e-commerce challenges are precisely there: knowing where to invest, when to accelerate, and how to retain your customers.
KPIs (key performance indicators) give you this view. Here is what they concretely allow:
- Arbitrate marketing investments: know which channels generate real value, not just volume
- Optimize the user experience: identify the pages that hinder conversion and those that accelerate it
- Manage retention: measure if your customers return and how much they spend over time
- Anticipate trends: detect weak signals before they become problems
To provide a concrete framework, here are the 2026 e-commerce benchmarks to remember: a conversion rate between 2 and 3.5%, an abandoned cart rate around 70%, an LTV/CAC ratio greater than 3:1, and a repurchase rate above 25% at 90 days.
These figures are not abstract goals. They constitute your compass to assess the e-commerce profitability of your store and quickly identify friction areas. A conversion rate of 1.2% on a well-positioned beauty store is a warning sign. An abandoned cart rate of 80% reveals a checkout or trust problem. It is not a matter of instinct, it is a precise reading of the data.
A high-performing Shopify site is not limited to a beautiful interface. It integrates from its design the mechanisms to collect, analyze, and activate data. This is what differentiates a store that stagnates from a store that grows.
Which KPIs to track on Shopify: the key indicators
Understanding why to measure is good. Knowing exactly which indicators to track is even better.
The essential e-commerce KPIs include conversion rate, average order value (AOV), cart abandonment rate, CAC, CLV/LTV, repurchase rate, and ROAS. Each illuminates a different dimension of your performance.

Here is a summary table to visualize the main indicators, their definition, and the target values to aim for in the beauty and fashion sectors:
| KPI | Definition | Target value (beauty/fashion) |
|---|---|---|
| Conversion rate | % of visitors who buy | 2 to 3.5% |
| Average order value (AOV) | Average value of an order | 45 to 90 € depending on the segment |
| Cart abandonment | % of unfinished carts | Target: less than 65% |
| CAC | Cost to acquire a new customer | Keep under 33% of LTV |
| LTV (Lifetime Value) | Total revenue generated by a customer | LTV:CAC ratio greater than 3:1 |
| Repurchase rate | % of customers who order again | Above 25% at 90 days |
| ROAS | Advertising revenue per euro spent | Minimum 3x for profitability |
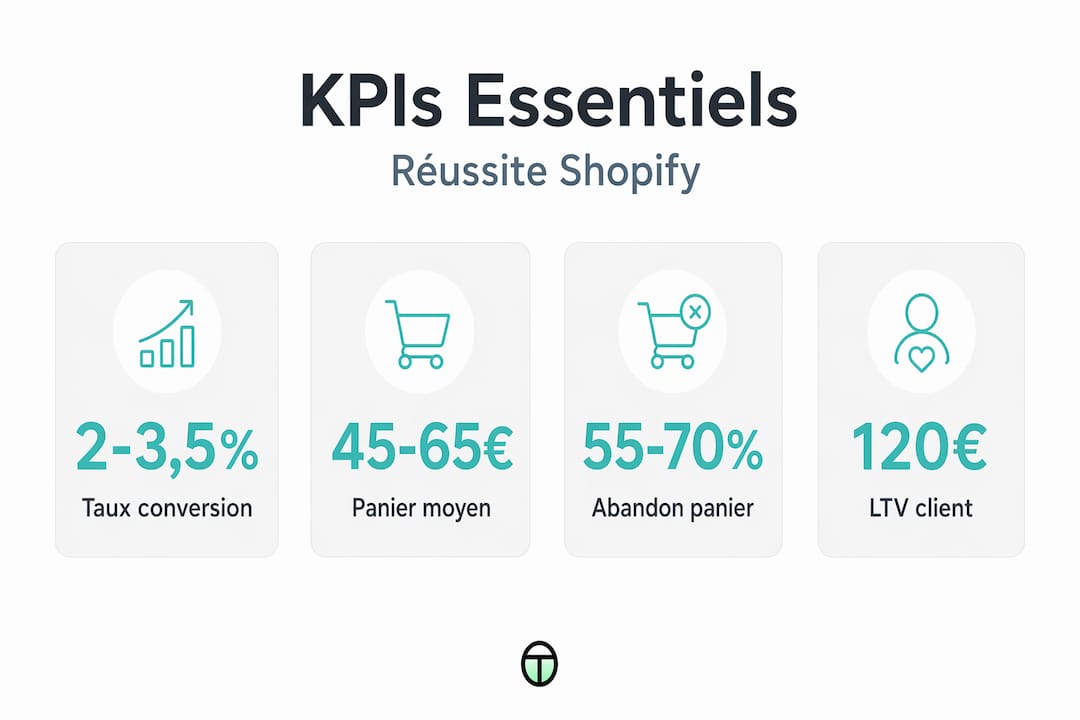
These figures make full sense when you cross-reference them. A high ROAS with a constantly increasing CAC indicates that your acquisition is becoming less efficient. An increasing AOV with a low repurchase rate signals a lack of retention. The KPIs of a high-performing site must be read as a system, not in silos.
Here are the most revealing combinations of indicators to monitor:
- Conversion rate + bounce rate: a high bounce rate with low conversion points to a UX or ad targeting problem
- CAC + LTV by channel: compare the real efficiency of each acquisition source
- AOV + purchase frequency: identify the most valuable segments of your customer base
- ROAS + net margin: ensure that advertising generates profit, not just revenue
The most effective Shopify beauty sales solutions integrate these cross-references from the analytical design phase.
Pro tip: Never track a KPI in isolation. The correlation between two or three indicators will always tell you more than the analysis of a single figure. Create dashboards that display these relationships simultaneously.
Methodologies and tools to analyze e-commerce performance
The identified indicators, let's see how to analyze them concretely, with the best tools and methods available.
Shopify and Google Analytics 4 (GA4) are complementary. Shopify Analytics covers sales, AOV, and customer data. GA4 analyzes traffic, engagement, and browsing behaviors. One without the other leaves blind spots in your analysis.
Here are the concrete steps to set up an effective analysis:
-
Configure Shopify Analytics: activate sales reports, customer reports (new vs loyal), and conversion reports by channel. This data is natively available in your Shopify dashboard.
-
Connect GA4 to your store: install the GA4 pixel via Google Tag Manager to track key events (product view, add to cart, checkout initiation, purchase). This allows you to analyze complete user journeys.
-
Practice cross-analysis: a high bounce rate in GA4 combined with low conversion in Shopify Analytics indicates a UX problem. A drop in organic traffic in GA4 with stable sales signals good retention but fragile acquisition.
-
Adapt the cadence of your reviews: daily reviews are used to detect anomalies (checkout outage, refund spike, traffic drop). Weekly reviews identify short-term trends. Monthly reviews allow strategic decisions.
“The complementarity between Shopify Analytics and GA4 is precisely what allows you to move from a superficial reading of sales to a fine understanding of customer behaviors and real optimization levers.”
The exploitation of beauty e-commerce data on Shopify requires rigorous organization. Define managers for each review level, standardize your reports, and document the decisions made in response to the data.
Pro tip: Adopt an adaptive review: if an indicator deviates by more than 15% from the previous week, trigger an immediate in-depth analysis, without waiting for the next monthly review. This responsiveness can make the difference between an early detected problem and a negative trend that settles in.
Cohort analysis and advanced nuances for performance
Classic average analysis is not enough. Let's go deeper with advanced nuances for truly profitable strategies.
Cohort analysis on Shopify consists of grouping customers by acquisition month and tracking their LTV and retention over time. This method reveals if the quality of your customers is improving or degrading, which overall averages systematically mask.
Let's take a concrete example. Your average LTV over 12 months is €120. On the surface, that is satisfactory. But cohort analysis reveals that customers acquired via an Instagram campaign in January have an LTV of €85 at 12 months, while those acquired via organic search in March reach €160. The average hid a reality: your SEO channel generates customers twice as valuable as your social campaigns.
| Approach | What it shows | Limit |
|---|---|---|
| Overall average | Quick view of performance | Masks variations by segment and channel |
| Cohort analysis | Qualitative evolution by acquisition group | Requires sufficient data history |
Here are the most frequent biases to absolutely avoid:
- Positive ROAS but zero profit: aggressive promotions can inflate ROAS while eroding margin. An isolated KPI like ROAS says nothing about real profitability.
- Promotions that degrade LTV: aggressive welcome offers attract opportunistic buyers who never return. Promotions can lower LTV by 20 to 40%.
- Deceptive blended CAC: adding up all acquisition costs without distinguishing channels masks inefficiencies. One channel can be profitable while another consumes your budget without return.
- CAC greater than 33% of LTV: this is the critical threshold beyond which your acquisition model becomes structurally unviable.
Shopify conversion optimization and work on conversion micro-interactions only produce their full effect if you measure their impacts by cohort, not just on overall averages.
Pro tip: Prioritize the LTV:CAC ratio by cohort and by channel. This is the indicator that reveals the true economic health of your acquisition. If this ratio drops below 2:1 on a recent cohort, it is a priority warning signal, even if your overall ROAS remains satisfactory.
Our point of view: what most e-commerce managers overlook
After years of supporting beauty and fashion brands on Shopify, we have observed a repeating pattern. The majority of e-commerce teams spend a lot of time optimizing their ROAS and very little analyzing the real health of their customer base.
ROAS is a start-of-journey indicator. It measures the efficiency of a campaign over a short window, often 7 or 28 days. But it says nothing about the quality of the acquired customers, about their propensity to return, about the margin they really generate after return costs and discounts. Shopify data transformed into decisions constitutes the real profitability lever in the face of constantly increasing advertising costs.
What most ignore: a store can show apparent revenue growth while seeing its profitability degrade. Promotions inflate sales, acquisition goes wild, but costs increase faster than the generated value. Cohort management is precisely what reveals this reality before it becomes a structural problem.
Our conviction at Tamara Agency is that true multi-level management, the one that cross-references conversion, LTV by cohort, CAC by channel, and customer behaviors, is still rare. It requires an organization, well-configured tools, and a data-driven decision culture at the service of your e-commerce. This is what we help our clients build, not just a beautiful site, but a real performance system.
Take action: optimize your Shopify store with Tamara Agency
You now have a clear view of the KPIs to track, the analysis methods to deploy, and the pitfalls to avoid. The next step is to transform this knowledge into concrete actions on your store.

At Tamara Agency, we have been supporting beauty, fashion, and wellness brands since 2018 to create and develop Shopify stores that perform as well as they captivate. Whether you are looking for a store redesign, advanced analytics setup, or ongoing monthly support to drive performance, our teams are here for you. We work on structure, UX, data flows, and strategy, so that every decision is informed and every investment profitable. Contact us for an initial strategic consultation tailored to your industry and ambitions.
Frequently Asked Questions About E-commerce Performance
What are the essential KPIs for managing a Shopify store?
The essential KPIs are conversion rate, average order value, cart abandonment rate, CAC, LTV, repurchase rate, and ROAS. Together, these seven metrics cover acquisition, conversion, and customer retention.
How often should e-commerce performance be analyzed?
Daily, weekly, and monthly reviews correspond to three different levels of analysis: detecting anomalies, identifying short-term trends, and making strategic decisions. Each has its own purpose and does not replace the others.
How to avoid the pitfalls of isolated KPIs or vanity metrics?
Always cross-reference your metrics and analyze your cohorts: a high CAC compared to a low CLV reveals an unprofitable acquisition strategy that overall averages never clearly show.
Why does cohort analysis provide greater value than a simple average?
Cohort analysis groups customers by acquisition month and tracks their LTV over time, revealing whether the quality of your customers is improving or declining, whereas overall averages mask these critical trends.